Greenhouse Gas Monitoring at the World Meteorological Organization: From Science to Services
- Author(s):
- Oksana Tarasova (WMO), Jarin Tasneem Oyshi (WMO)

Early studies of atmospheric composition were driven by scientific curiosity. In the 18th century, scientists identified key atmospheric constituents, including carbon dioxide (CO2) and methane (CH4) and began describing their properties in scientific literature.
Scottish chemist Joseph Black formally discovered CO2 in the early 1750s by exposing magnesium carbonate to acid. He called it “fixed air” because it had previously been bound within a solid material. Methane was discovered in 1776 by Italian physicist Alessandro Volta. While exploring the marshy shores of Lake Maggiore in Italy, he collected gas bubbles released from the sediment and identified them as a unique flammable air.
In 1896, Swedish scientist Svante Arrhenius calculated that halving the amount of CO2 in the atmosphere could lower temperatures in Europe by around 4°–5°C, while doubling it would raise Earth's temperature by 5°–6°C. Already at that time, Arrhenius noted that industry had an impact on the levels of CO2 in the atmosphere, although he did not foresee the scale of future fossil fuel emissions. More than a century later, greenhouse gas (GHG) concentrations paint a stark picture. The latest analysis shows that globally averaged surface concentrations of CO2, CH4 and nitrous oxide (N2O) reached record levels in 2024, with CO2 at 423.9±0.2 parts per million (ppm), CH4 at 1942±2 ppb and N2O at 338.0±0.1 ppb. These values represent 152%, 266% and 125% of pre-industrial (before 1750) levels, respectively.
Measuring the atmosphere
This analysis is possible thanks to decades of atmospheric observations performed by the scientific community and coordinated by the World Meteorological Organization (WMO). In 1958, Charles Keeling of the Scripps Institution of Oceanography in San Diego began precise measurements of CO2 to establish a baseline against which future changes could be measured. These observations serve as a global reference for the changing levels of CO2 until today through the “Keeling Curve”(Figure 1). Several other stations joined the initiative, and in 1967, the Background Air Pollution Monitoring Network (BapMoN) was formed. This network later became part of the WMO Global Atmosphere Watch (GAW) Programme.


Since atmospheric observations began in the 1960s, it became clear that measurements from different laboratories could only be compared reliably if they were expressed using the same units and reference scales. This is particularly important because the changes scientists seek to measure are often very small relative to the overall concentration of GHGs already present in the atmosphere.
WMO has played a central role in facilitating international cooperation on GHG observations and analysis. Since 1975, WMO has supported the meetings of experts on Greenhouse Gas and Related Tracer Measurement Techniques (GGMT). The first meeting was held at the Scripps Institution of Oceanography in the United States and has since been held every two years.


Understanding sources, sinks and climate feedbacks
Precise global atmospheric observations of GHGs show continued increase in concentration. In the case of CO2, the rate of increase is also accelerating. The largest annual increase on record was observed between 2023 and 2024, as reported in the latest WMO GHG Bulletin (Figure 3).

The three GHGs (CO2, CH4 and N2O) are closely linked to anthropogenic (human) activities and interact strongly with the biosphere and the oceans. Predicting future atmospheric concentrations requires a quantitative understanding of the many GHG sources, sinks and chemical transformations in the atmosphere, as well as projections of future climate conditions.CO2 is the main anthropogenic GHG and the largest contributor to warming caused by long-lived GHGs. According to the latest analysis by the Global Carbon Project, natural systems remove around half of anthropogenic CO2 emissions, with land ecosystems accounting for 21% and the ocean for 29% on average over the 2015 – 2024 period. The remainder accumulates in the atmosphere.
However, the strength of these natural carbon sinks varies from year to year. Processes such as El Niño and feedbacks driven by climate change can strongly influence how much CO2 is removed by land and oceans.
One important mechanism is the response of the biosphere to drought conditions. Such conditions can increase forest flammability, leading to direct CO2 emissions through biomass burning. They can also alter the balance between respiration and photosynthesis turning ecosystems from carbon sink to carbon sources. This shift has been demonstrated by direct observations in parts of the Amazon.
The Amazon is considered a potential climate tipping element. This means that beyond certain thresholds, environmental changes and climate feedbacks could trigger large and potentially irreversible changes in the ecosystem. Observing changes in the Amazon carbon cycle is therefore particularly important.
WMO works closely with Brazil’s National Institute for Space Research to improve understanding of long-term changes in the Amazon Carbon Balance. Over the past 15 years, during which these measurements were conducted, the Amazon has experienced reduced rainfall, higher temperatures and longer dry seasons which made the forest more flammable. Severe drought in 2023 led to exceptionally high fire emissions, as indicated by long-term atmospheric measurements.
Using these 15-year observations, scientists estimated total CO2 emissions, fire-related CO2 emissions and net biome exchange (NBE) which describes the total, long-term net balance of carbon exchanged between a terrestrial ecosystem (e.g. forest, biome) and the atmosphere, including emissions from fires and other processes. For the 2010 – 2022 period, the Amazon carbon balance showed an emission of 0.37 PgC/year. Emissions increased from 0.31 PgC per year during 2010 – 2018 to 0.51 PgC per year during 2019 – 2022.
These findings indicate that forest emissions from respiration and biomass burning exceeded the CO2 uptake through the photosynthesis, meaning that the Amazon acted overall as a net source of CO2 to the atmosphere during this period. Similar changes in forest carbon uptake have been observed in other regions. In 2022, Europe experienced record-breaking summer and autumn temperatures. Close to 30% of the European continent was under severe summer drought. A study led by scientists from the Integrated Global Carbon Observation System (ICOS) showed that these extreme conditions reduced summer CO2 uptake by the biosphere by an estimated 56–62 TgC across drought-affected areas. This reduction exceeded the annual emissions of the Netherlands and represented about 80% of the total yearly emissions of France.
Other climate feedbacks may also intensify in response to climate change, from increased CH4 emissions associated with thawing permafrost to reduced ocean CO2 uptake as warmer water absorbs less gas. For example, Muller et al in their 2025 paper showed that the global non-polar ocean absorbed about 10% less CO2 than expected, based on observation-derived estimates of ocean-atmosphere CO2 exchange.
From observations to services
GHG observations coordinated by WMO are critical for understanding the drivers of climate change and associated feedbacks. As atmospheric observations and modelling capabilities have advanced, increasing attention has been given to how these observations can support improved understanding of GHG emissions and removals at different scales.
By 2010, the atmospheric observations of GHGs had become easier to perform. At the same time, advances in numerical modelling improved inverse modelling techniques, which use observed atmospheric GHG concentrations to estimate where emissions and removals are occurring on the Earth’s surface. These approaches help scientists better understand the distribution of GHG sources and sinks.
To support its Members in the use of these emerging approaches, WMO initiated development of the Integrated Greenhouse Gas Information System (IG3IS) during the sixteenth session of the Commission for Atmospheric Sciences in 2013. This system was subsequently approved by the seventeenth World Meteorological Congress.
Within the IG3IS framework, atmospheric concentration measurements are combined with socio-economic inventory data to improve estimates of GHG emissions and removals. The key feature of the system is that it can be applied at multiple scales, from individual facilities to urban and national levels.
As the initiative has developed, WMO has worked closely with stakeholders and users to co-developed information products and strengthen understanding of how atmospheric observations can support different applications. To better understand user requirements and application, WMO organizes regular stakeholder consultations. The latest consultation, held from 20 to 22 April 2026, brought together more than 100 participants.
IG3IS supports the development of consistent methods and standards for estimating GHG emissions and removals across different applications and scales. For example, in 2025, WMO published guidance on the use of atmospheric observations to improve the quantification of emissions and removals at a national and urban scale.
The journey from Arrhenius’ early theoretical work to today’s global GHG monitoring networks reflects a remarkable evolution in atmospheric science. While significant progress has been made, important challenges remain. Critical observational gaps still need to be filled. New, cheaper and easier-to-operate instruments need to be developed and deployed. The capacity to take GHG measurements and interpret the data needs to be strengthened across regions.
What began as scientific curiosity about the greenhouse effect has evolved into a global scientific effort to better understand GHG sources, sinks and their interactions with the Earth system. Continued observations and international cooperation will remain essential for improving understanding of the changing atmospheric composition and its role in the climate system.


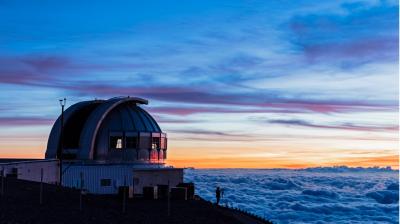 at sunset. Source- westend61.jpg")


