Northern Hemisphere snow can now be reliably estimated
For the first time, snow researchers from the Finnish Meteorological Institute in collaboration with Environment and Climate Change Canada have reliably estimated the amount and the trend in the seasonal snow of the Northern Hemisphere between 1980 and 2018.

For the first time, snow researchers from the Finnish Meteorological Institute in collaboration with Environment and Climate Change Canada have reliably estimated the amount and the trend in the seasonal snow of the Northern Hemisphere between 1980 and 2018.
According to the study published in the scientific journal Nature on May 20, 2020, snow mass has remained the same in Eurasia, but decreased significantly in North America, although the extent of snow cover has decreased simultaneously in both continental regions.
The study originated in the context of the multi-year collaboration of the snow researchers involved in Snow Watch activities of WMO’s Global Cryosphere Watch project.
The amount of snow cover and its changes affect the climate system (including the carbon cycle) and freshwater resources. The increased reliability in snow estimates is critical to improving the quality of weather forecasts and provide more accurate information on flood risks. In addition, a more accurate historical time series can be used to analyse and develop the reliability of climate models.
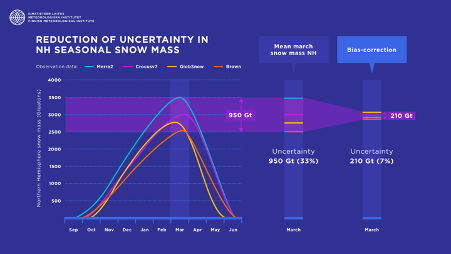
The uncertainty in the estimation of the amount of snow has decreased from 33% to 7.4%

Figure 1. Using a method developed by researchers at the Finnish Meteorological Institute, various snow observations can be combined. The method reduces the error margins of the observations from 33% to 7%. Finnish Meteorological Institute.
The amount of snow and the changes in it are determined by satellite observations and with measurements made from the ground. In the past, estimates of the amount of snow in the northern latitudes have varied so much between different datasets that it has not been possible to obtain a coherent and reliable overall picture of the amount of snow. The recently published paper in the Nature journal outlined a method to reduce the error margins of various observations, see figure 1.
“The method can be used to combine different observations and it provides more accurate information about the amount of snow than ever before. The previous considerable uncertainty of 33% in the amount of snow has decreased to 7.4%,” said Jouni Pulliainen, the main contributor to the article and Research Professor at the Finnish Meteorological Institute.
The snow mass has remained the same, but the extent of snow cover has decreased
The researchers found that there has been little reduction in snow mass over the 40 years in the Northern Hemisphere when looking at the annual maximum amount of snow at the turn of February-March.
However, the extent of the snow cover has decreased significantly over the same period, especially in late spring. The change in the extent of snow cover is visible both on the entire northern hemisphere and in the Arctic (figure 2)
"In the past, estimates of global and regional snowfall trends have only been indicative. The results show that the amount of rainfall has increased in the northern regions, especially in the northern parts of Asia,” Jouni Pulliainen said.
In northern areas, where rainfall generally turns to snow in winter, the snow mass has remained the same or even increased. In the southern parts, where in winter rainfall comes down as water rather than snow, both the extent of the snow cover and the snow mass have decreased.

Figure 2. Changes in snow mass between 1980 and 2018. In areas A-E, large regional changes in the amount of snow are observed. In the red areas (A, E) the snow mass has decreased, in the blue areas (B, C, D) the snow mass has increased. The scale is the change in the water value of snow in millimetres per 10 years (the water value indicates how high a column of water the snow corresponds to when melted). Finnish Meteorological Institute, modified from the chart presented in the Nature article
This past winter the snow line has been hundreds, in some places even thousands of kilometres north of normal
“The snow line across the globe has been more northern than normal this winter, while in the northern latitudes there is much more snow in many places than in the average years,” said Kari Luojus, head of satellite services and research group at the Finnish Meteorological Institute and co-author of the Nature article.
During the winter of 2020, the extent of snow cover has been significantly lower than average, especially in Europe. In Europe, the snow line has been hundreds, in some places even thousands of kilometres north of normal. On the other hand, in the northernmost parts of Europe and Eurasia, there has been significantly more snow than the average.
In North America, the amount of snow has also been higher than on average in the northern latitudes. In the early winter, there were numerous large snowstorms that brought a large amount of snow to the area with each storm.
International collaboration – a key to reliable and comprehensive results
The research for this publication originated and was partially conducted in the context of the Satellite Snow Product Intercomparison and Evaluation Exercise (SnowPEx) project. This was proposed at the workshop organized by the WMO Global Cryosphere Watch - Snow Watch Team, in January 2013, in recognition of the priority to evaluate and consolidate snow products based on different satellite sensors and retrieval methods.
SnowPEx was a truly international effort with the participation of experts from US, Canada, China, Japan, and most of European countries that deal with snow: Finland, Sweden, Norway, Austria, Switzerland, France, Italy, UK, Germany. The project was funded to a large extent by the European Space Agency and with significant contributions from the participating organizations.
Dr Chris Derksen from Environment and Climate Change Canada noted that “SnowPEx was a very successful initiative which facilitated the assessment of a large number of northern hemisphere snow water equivalent datasets. The analysis illustrated the important contributions from both remote sensing and land surface modelling communities. Notably, the results from SnowPEx illustrate the value in combining multiple independent datasets to improve overall accuracy, and provide quantitative estimates of observational uncertainty.”

Snow mass in the Northern Hemisphere in gigatonnes. The amount of snow this winter is shown in red, the most recent observation is from 13 May 2020. The average snow mass from 1982 to 2012 is shown in the chart with a black dashed line. Data from satellite observations and ground measurements. Finnish Meteorological Institute and WMO Global Cryosphere Watch.
In parallel, within the framework of GCW, the Snow Watch Team has continued to produce and publish regularly several snow trackers, such as the Environment Canada (EC) GCW Snow Cover Extent Tracker which provides an estimate of the current Northern Hemisphere snow cover extent relative to the 1998-2011 period based on the Canadian Meteorological Centre operational daily snow depth analysis, and the FMI/GCW SWE Tracker, based on GlobSnow snow water equivalent (SWE). It was developed as part of the GCW Snow Watch project and illustrates the current Northern Hemisphere snow water equivalent relative to the long-term mean and variability (figure 3)
The Nature study is entitled "Patterns and trends of Northern Hemisphere snow mass from 1980 to 2018" authored by: Pulliainen, Jouni; Luojus, Kari; Derksen, Chris; Mudryk, Lawrence; Lemmetyinen, Juha; Salminen, Miia; Ikonen, Jaakko; Takala, Matias; Cohen, Juval; Smolander, Tuomo; Norberg, Johannes and published in the Journal Nature, The study is available here


