February: mixed temperatures highlight new “climate norms"
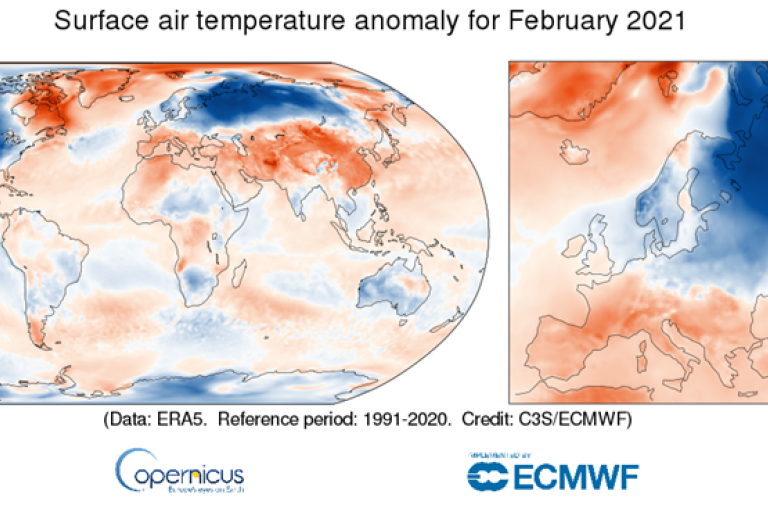
The northern hemisphere winter and southern hemisphere summer exhibited very mixed climate patterns, with below average temperatures in parts of the world. But the gradual introduction of updated “climate norms” gives rise to the question as to what is an average temperature.
For boreal winter, the region of most above average temperatures covered northeastern Canada, Greenland and the Arctic ocean, whereas Siberia stands out as the region with the most below average temperatures, according to a new climate report from Copernicus Climate Change Service implemented by the European Centre for Medium Range Weather Forecasts (ECMWF).
February temperature was much below the 1991-2020 average over much of the Russian Federation and North America, but much above average over parts of the Arctic and in a band stretching eastward from north-western Africa and southern Europe to China.
The contiguous USA had its coldest February since 1989. Based on preliminary data, 62 all-time daily cold minimum temperature records were broken from February 11-16 and 69 all-time daily cold maximum temperature records on February 15-16, according to the US National Oceanic and Atmospheric Administration.
February 2021 sea ice extent was below average in both polar regions, though not exceptionally so. In the Arctic, sea ice was most below average along northeastern Canada, with a mix along Eurasia, according to Copernicus Climate Change Service.
Negative Arctic Oscillation
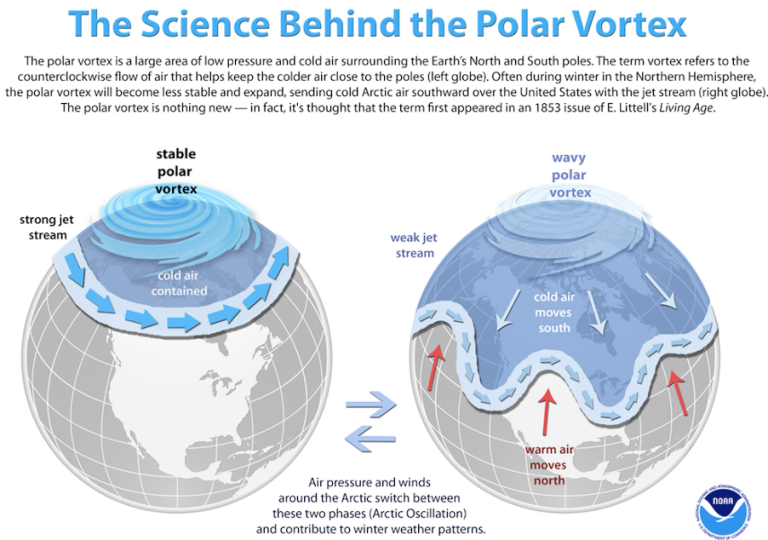
The stratospheric warming event led to a weakening of the polar vortex, which is an area of low pressure and cold air surrounding the Earth’s North and South poles, with swirling westerly jet stream winds circulating around them. Typically, those winds are strong enough to keep the coldest air in the Arctic during the winter. The weakening allowed the cold air to spill out into the mid-latitudes, including the USA, and for the warmer air to enter the Arctic.
An index called the Arctic Oscillation measures the extent to which polar air is either held back in the Arctic or meanders southwards. A positive Arctic Oscillation indicates cold air is trapped in the Arctic; and a negative one means that cold air crashes south as the jet stream weakens.
Repeated disruptions of the polar vortex resulted in a strongly negative Arctic oscillation since early December 2020. This translated into a warm Arctic, cold continent pattern, with cold waves in Europe, as well as episodes of heavy precipitation particularly over southern Europe and the Mediterranean rim countries, and Atlantic storms.
Climate Change
The fact that February was a relatively cold month does not negate the long-term warming trend from climate change.
In general, cold waves are becoming more infrequent as a result of climate change and there has been a decline in new cold temperature records as a result of global warming. But frigid temperatures and snow will continue to be part of our typical weather patterns in the northern hemisphere winter.
In its Fifth Assessment Report, the Intergovernmental Panel on Climate Change said it is "virtually certain that there will be more frequent hot and fewer cold temperature extremes over most land areas on daily and seasonal timescales as global mean temperatures increase. It is very likely that heat waves will occur with a higher frequency and duration. Occasional cold winter extremes will continue to occur."
Research is still continuing in how warming Arctic air masses and declining sea ice are affecting ocean circulation and the jet stream, thus impacting weather in mid-latitudes.
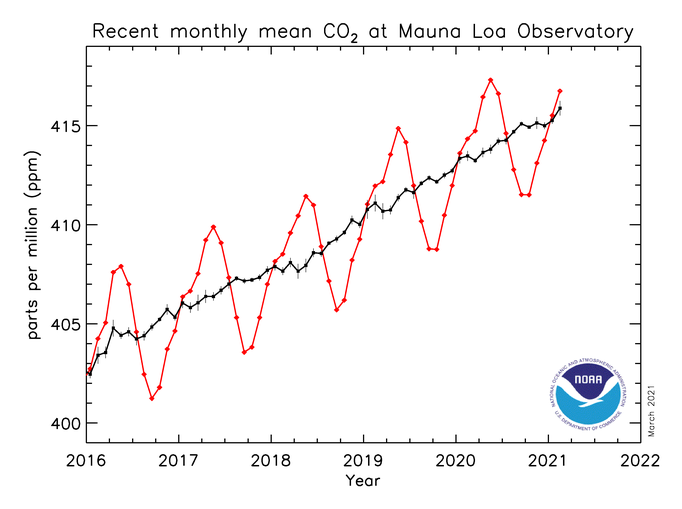
Greenhouse gas concentrations continue to rise. Mauna Loa station in Hawaii, which is used as a benchmark reference station, reported that average carbon dioxide concentrations in February were 416.75 parts per million, up from 413.4 parts per million in February 2020.
Climate Norms
Globally, February 2021 was close to the 1991-2020 average, according to the Copernicus Climate Change Service, which has has recently switched to a new 1991-2020 baseline to calculate climatological averages. National Meteorological and Hydrological Services in Europe and some other parts of the world have also introduced the update. Others are expected to follow.
Human-induced global warming and natural variations from year to year, and decade to decade, shape our climate. So climatologists, use standard reference periods, as defined by the World Meteorological Organization (WMO), to create average ‘climate normals’ that represent what can be considered a typical climate for that period.
Until the end of 2020, the most current and widely used standard reference period for calculating climate normals was the 30-year period 1981-2010. WMO’s recent Services Commission meeting recommended that the new 30-year baseline, 1991-2020, should be adopted globally and pledged support to Members to help them update their figures.
It is necessary to update the climate normals to support decision-makers in climate sensitive sectors such as agriculture, health, energy, infrastructure and transportation. However, for the purposes of historical comparison and climate change monitoring, WMO still recommends the continuation of the 1961-1990 period for the computation and tracking global climate anomalies relative to a fixed and common reference period.
For the purpose of Paris Agreement on climate change and its temperature targets, WMO also uses the pre-industrial era as the baseline for tracking global temperature increase in its annual State of the Global Climate report. Thus, the average global temperature in 2020 was about 1.2 °C above the pre-industrial (1850-1900) level


