East Africa - Seasonal outlook for the “short rains season”
Long-term drought situation
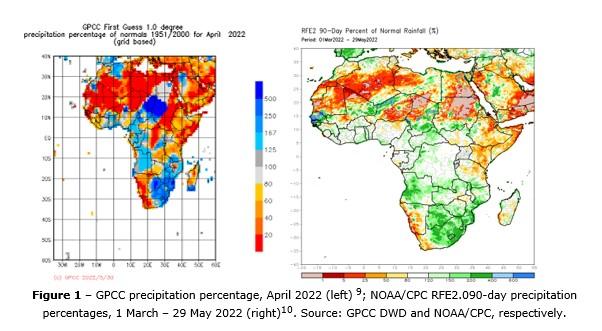
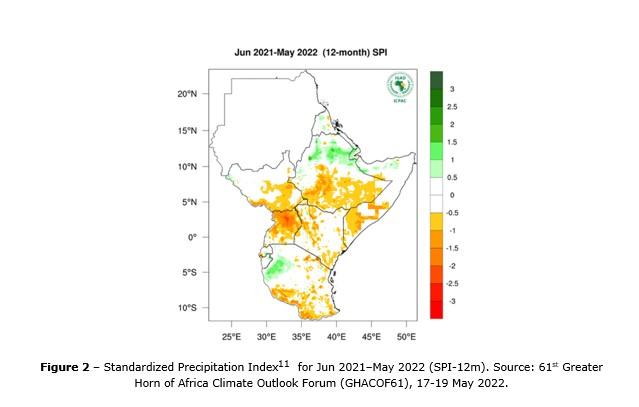
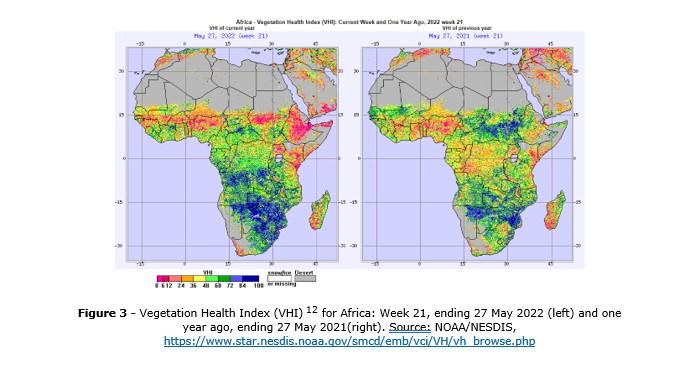
A severe drought is affecting eastern and central regions of the Greater Horn of Africa (GHA) and is likely the worst drought in 40 years, after a fourth consecutive below‑average rainfall season (Figure 1). Long-term drought (Figure 2) and poor vegetation conditions (Figure 3) reflect persisting drier-than-normal rainfall seasons.
Seasonal outlook
Recently the GHACOF61 outlook[1] for June to September 2022, suggested increased chances for wetter-than-normal conditions over northern parts of GHA, where this period is an important rainfall season. This is consistent with the Global Seasonal Climate Update (GSCU) for June-August 2022[2]. In the eastern and south-eastern parts of the region, where drought is currently more acute, water deficits will be exacerbated not only due to the failed March-May rainfall season but also by abnormally high air temperatures (increasing soil and plants moisture losses – evapotranspiration), which are forecasted to continue into the June–September dry season. The “short rains” season, normally from October to December would be the next window of opportunity to ease drought but predictions for drier-than-normal conditions and continuation of strong positive temperature anomalies, in case confirmed, will push towards a further deterioration of drought situation and its impacts.
El Niño/La Niña Southern Oscillation (ENSO)
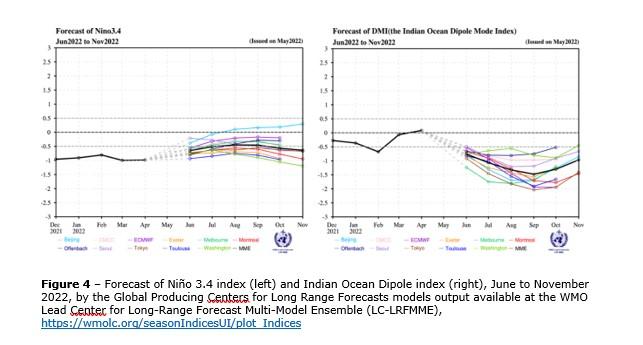
The multiyear La Niña conditions, which started in September 2020 and contributed to the exceptional four-season drought in the GHA, continued to prevail in May 2022 across the central and eastern equatorial Pacific[3]. WMO Global Producing Centers for Long Range Forecasts (GPCs-LRF) models’ outputs available at the WMO Lead Center for Long Range Forecast Multi-Model Ensemble (LC-LRFMME) (Figure 4-left), indicate that there is a high probability of the current La Niña conditions extending into boreal summer 2022 and continuing thereafter[4]. La Nina is a naturally occurring phenomena which can shift rainfall patterns across the globe. The impacts of each La Niña are never exactly the same, as they depend on the intensity of the event, the time of year when it develops and the interaction with other climate patterns. Although, consecutive La Nina events’ impacts and related losses become more prolonged and amplified.
Indian Ocean Dipole (IOD)
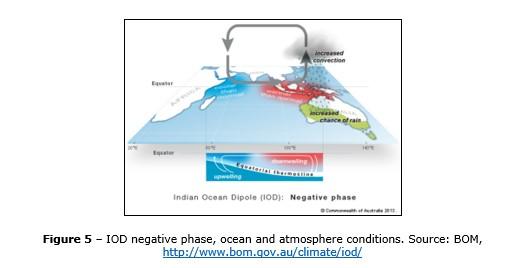
The Indian Ocean Dipole (IOD) is currently neutral. The GPCs-LRF climate model outlooks suggest a negative IOD may develop in the coming months and there is strong forecast consistency (Figure 4-right). It is important to note that model outlooks tend to have low accuracy at this time of year and some caution should be taken with IOD outlooks[5]. The IOD is the leading natural mode of interannual variability of SSTs in the tropical Indian Ocean. Usually, a negative IOD increases subsidence over the western Indian Ocean and dry anomalies over East Africa (Figure 5).
Precipitation and temperature forecast for September – November 2022
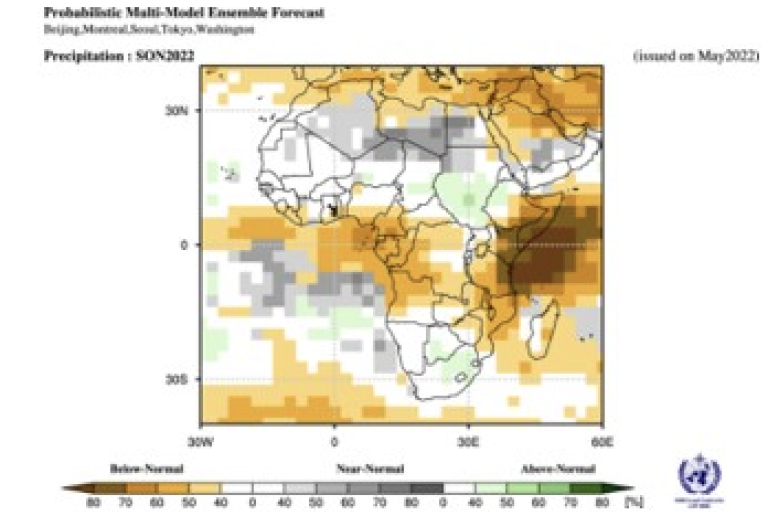
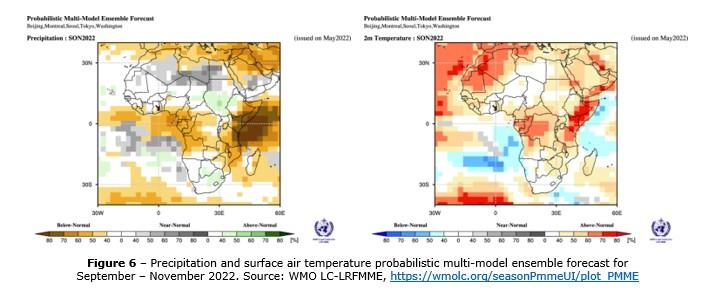
The global models’ outputs currently available at WMO LC-LRFMME go up to November 2022 and show that there is increasing model consistency, together with ocean and atmosphere indicators, suggesting a warmer and drier-than-average September to November period (Figure 6), which in big part matches with the “short rains” season (October-December) in East Africa. Nevertheless, the confidence (skill) of models is very low for such forecast lead time (about 6 months), so a close monitoring of next months’ outlooks is recommended as the forecast uncertainty is expected to decrease enabling a more robust assessment of the situation[6].
Understanding the possible causes
Many studies have shown the relationship between the East African “short rains” and Sea Surface Temperature (SST) anomalies in the equatorial Pacifc Ocean and in the Indian Ocean, namely, the importance of the ENSO and IOD. In particular, when La Niña coincides with a negative IOD the chance of below-average “short rains” season in East Africa typically increases.
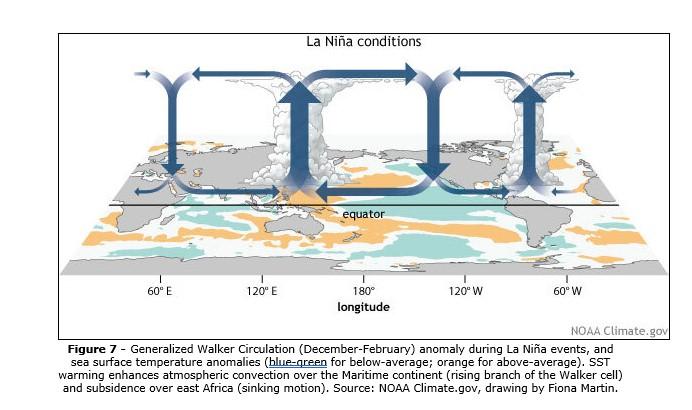
In relation to the long-term observed trends, the Intergovernmental Panel on Climate Change Sixth Assessment Report[7] states that there is evidence of a human contribution to observed decreases in mean precipitation and observed increase in the intensity and frequency of hot extremes in North Eastern Africa (NEAF)[8]. A decreasing precipitation amount of -2 to -7% per decade in the 1983–2010 period was reported for the March-to-May “Long rains season” in eastern Africa. Recent strengthening of the Pacific Walker Circulation (WC) that resembles a La Niña-like WC (illustrated on Figure 7) and its westward shift has been associated with reduced precipitation over eastern Africa and there is high confidence that changes in the WC are associated with changes in the water cycle over regions like the Maritime Continent, South America and Africa.
Footnote:
[1] 61st Greater Horn of Africa Climate Outlook Forum (GHACOF61), https://www.icpac.net/events/ghacof-61/.
[2] GSCU June-July-August 2022022: https://wmolc.org/gscuBoard/downloadExt?fn=GSCU_JJA%202022_update.pdf
[3] CPC/IRI, https://iri.columbia.edu/our-expertise/climate/forecasts/enso/current/?enso_tab=enso-quicklook; JMA, https://ds.data.jma.go.jp/tcc/tcc/products/elnino/outlook.html
[4] The WMO El Niño/La Niña Southern Oscillation (ENSO) Update will be released in early June providing up-to-date consensus outlook on this phenomenon. The WMO El Niño/La Niña Update is prepared on a quasi-regular basis (approximately every three months) through a collaborative effort between WMO and the International Research Institute for Climate and Society (IRI). It is based on contributions from the leading centres around the world monitoring and predicting this phenomenon and expert consensus facilitated by WMO and IRI. For more information on the Update and related aspects, please visit: https://public.wmo.int/en/our-mandate/climate/el-niñola-niña-update
[6] It is important to note that even in a situation of well above-average rainfall season, such long-term drought impacts will remain for long time, up to several months or years, after replenishment of water deficits.
[7] IPCC, 2021: Climate Change 2021: The Physical Science Basis. Contribution of Working Group I to the Sixth Assessment Report of the Intergovernmental Panel on Climate Change [Masson-Delmotte, V., P. Zhai, A. Pirani, S.L. Connors, C. Péan, S. Berger, N. Caud, Y. Chen, L. Goldfarb, M.I. Gomis, M. Huang, K. Leitzell, E. Lonnoy, J.B.R. Matthews, T.K. Maycock, T. Waterfield, O. Yelekçi, R. Yu, and B. Zhou (eds.)]. Cambridge University Press, Cambridge, United Kingdom and New York, NY, USA, In press, doi:10.1017/9781009157896
[8] IPCC AR6 WGI, Regional fact sheet – Africa: https://www.ipcc.ch/report/ar6/wg1/downloads/factsheets/IPCC_AR6_WGI_Regional_Fact_Sheet_Africa.pdf
[9] Global Precipitation Climatology Centre (GPCC), https://www.dwd.de/EN/ourservices/gpcc/gpcc.html
[10] NOAA/CPC African Rainfall Estimation Algorithm Version 2 (RFE 2.0), https://www.cpc.ncep.noaa.gov/products/GIS/GIS_DATA/rfe/index.php
[11] SPI is a drought index proposed in 1993 by McKee et al. For more information about this index, see Standardized Precipitation Index: User Guide (WMO-No. 1090).
[12] NOAA/NESDIS Vegetation Health index (VHI) is a proxy characterizing vegetation health or a combine estimation of moisture and thermal conditions. If value is below 40 different level of vegetation stress, losses of crop and pasture production might be expected, if above 60 there are favourable vegetation conditions.

