How Ocean Observations Help Us Understand and Forecast El Niño
- Author(s):
- Sarah Diouf (WMO), Juliet Hermes (GOOS), Toshio Suga (GOOS), Champika Gallage (WMO), Wilfran Moufouma Okia (WMO), José Alvaro Silva (WMO), Orens Pasqueron de Fommervault (GOOS), Ann-Christine Zinkann (UCAR/NOAA), Nan Hu (GOOS)

The 2026 El Niño is unfolding against an extraordinary backdrop: global oceans are warmer than ever observed. Over recent decades, the ocean has absorbed much of the excess heat trapped in the Earth's climate system. In 2025, ocean heat content reached its highest level in the 66-year observational record, exceeding the previous record set in 2024. Remarkably, each of the last nine years has set a new record. The pace of ocean warming has also accelerated, with the rate observed since 2005 being more than twice that recorded between 1960 – 2005.
Against this warming background, changes in the tropical Pacific can affect weather and climate far beyond the ocean basin. Sea-surface temperature (SST) anomalies in the central equatorial Pacific are commonly monitored in the Niño 3.4 region (170 °W-120 °W, 5 °S-5 °N), a key indicator of the El Niño-Southern Oscillation (ENSO). ENSO is the dominant source of year-to-year climate variability. Its warm phase, El Niño, and cool phase, La Niña, arise from coupled interactions between tropical Pacific Ocean temperatures and atmospheric circulation.
During El Niño, warmer-than-normal SSTs in the central and eastern equatorial Pacific shift convection, clouds and rainfall eastward, weakening the normal easterly trade winds. This reduces the normal upwelling of cold subsurface water in the eastern Pacific, allowing further surface warming and reinforcing the coupled ocean – atmosphere feedback. Atmospheric changes are accompanied by changes in ocean circulation, including eastward-propagating equatorial Kelvin waves, which transport warm subsurface water eastward across the tropical Pacific, redistributing heat and contributing to the development of El Niño.
During La Niña, cooler-than-average sea-surface temperatures strengthen the trade winds and increase cold-water upwelling, reinforcing the cooling. These changes in the tropical Pacific alter atmospheric circulation and can influence weather and climate patterns around the world.
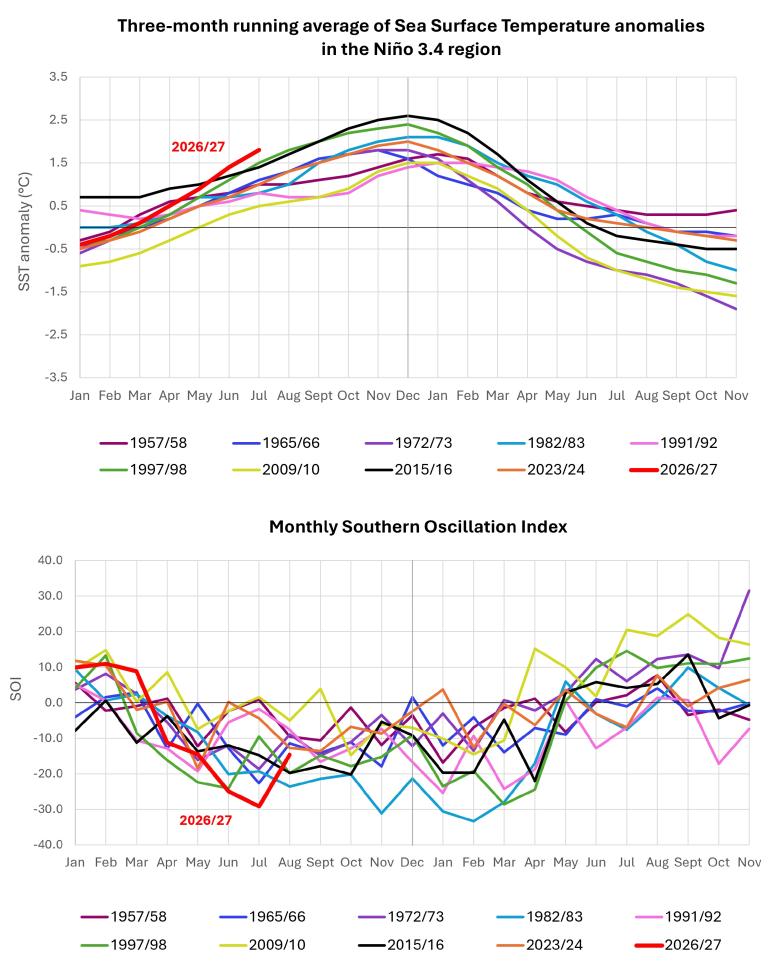
At the beginning of 2026, conditions in the Niño 3.4 region still showed weak La Niña conditions, with SST anomalies slightly below average. Temperatures then gradually returned to near-average conditions before rising sharply, with SST anomalies increasing by more than 1.5 °C between March and August 2026. From mid-May 2026 onward, SST anomalies exceeded those observed at the corresponding stage of any other major El Niño event included in the comparison since 1950 (Figure 1). El Niño conditions emerged in June and became firmly established by mid-August, marking the development of a major climate event.
The atmospheric evolution of the 2026 El Niño is also notable. The Southern Oscillation Index (SOI), which measures the difference in air pressure between the western and eastern tropical Pacific, shifted from positive values early in the year to strongly negative values from April onwards as the tropical Pacific Ocean warmed, reaching –24.9 in June and –29.1 in July (Figure 1). These were the lowest SOI values recorded for June and July among the major El Niño events shown in the comparison. The strongly negative SOI indicates a marked weakening of the Walker circulation, the large-scale atmospheric circulation across the tropical Pacific that normally helps maintain warmer waters in the west and cooler waters in the east. The rapid transition from positive to strongly negative SOI illustrates the reinforcing interaction between the ocean and atmosphere that supports the development of El Niño conditions.
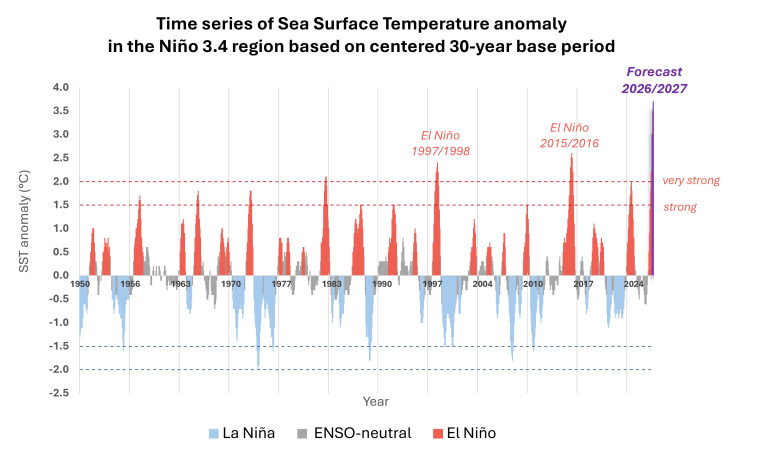
Multi-model ensemble forecasts issued in August indicate further intensification, with seasonal average SST anomalies of approximately 3.6 °C (±0.4) for September – October – November. Forecasts issued in September indicated seasonal average SST anomalies of 3.7 °C (±0.4) for October – November – December 2026. The forecasts suggested that the event would exceed the threshold for a very strong El Niño during the northern hemisphere autumn and persist into early 2027. A very strong El Niño is generally defined by a three-month average SST anomaly of at least 2.0 °C in the Niño 3.4 region.
These forecast values are exceptionally high compared to past El Niño events. If these forecasts prove accurate, the event would be ranked among the strongest El Niño events in the historical record since 1950, potentially exceeding previous major events such as 1997/98 and 2015/16 (Figure 2). However, these comparisons should be interpreted with caution, as the forecast anomalies use a fixed 1993 – 2009 reference period, while historical anomalies are calculated using centred 30-year reference periods.
The 2026 El Niño is therefore notable not only for its forecasted intensity, but also for the warmer ocean in which it is developing, raising an important question: how to detect and track the emergence of El Niño and distinguish its evolving signal from the already warm background ocean?
The observing networks tracking El Niño
Understanding the development of El Niño requires continuous observations of the ocean and atmosphere, from space to the ocean surface and down into the ocean interior.The earliest signs of an emerging El Niño are not always visible at the surface. Changes in subsurface heat content, temperature and salinity structure, sea level and ocean circulation can reveal how heat is being redistributed within the Pacific and provide important clues about the event’s potential development before its full signature appears at the surface.
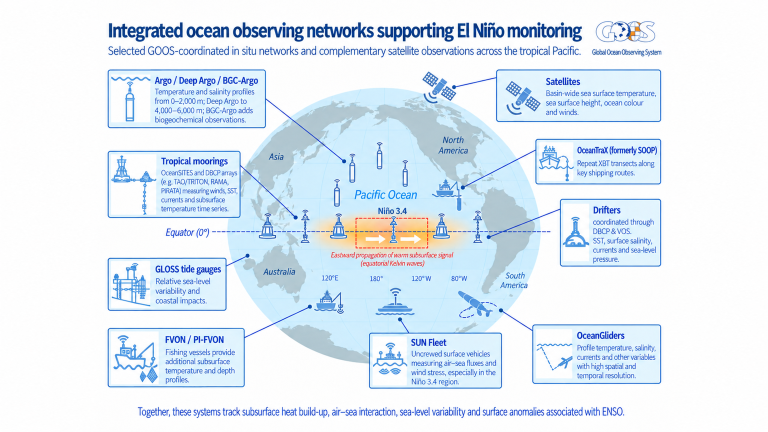
Sustained observing systems are essential. The Global Ocean Observing System (GOOS) provides the broader framework for sustained ocean observations, bringing together 17 global ocean observing networks that collectively monitor the ocean. Ten of these networks directly contribute to ENSO monitoring, supporting the detection, understanding and prediction of El Niño and other changes in the climate system (Figure 3).
At the regional level, the Tropical Pacific Observing System (TPOS), operating under the auspices of GOOS, provides the coordination framework for observations across the tropical Pacific. Long-term records coordinated through TPOS are particularly valuable for understanding the 2026 El Niño, as they provide the historical context needed to assess how the event is developing against an exceptionally warm background ocean.
The international Argo programme operates a global network of autonomous floats that typically measure ocean conditions from the surface to 2 000 metre depth every 10 days and transmit data in near real time via satellite. These floats provide a foundational three-dimensional view of ocean temperature and salinity and are essential for tracking upper-ocean heat content, barrier-layer formation and the eastward propagation of subsurface downwelling Kelvin waves that precede and sustain El Niño events. They are complemented by expendable bathythermographs (XBTs), instruments deployed from ships to measure temperature at different ocean depths. These measurements, collected along repeated transects through the OceanTraX network (formerly the Ship of Opportunity Programme), provide high-resolution vertical temperature profiles across key ocean currents, capturing upper-ocean heat content anomalies and variations in thermal structure.
In addition to sustained observations, targeted deployments of uncrewed surface vehicles (SUN Fleet) and autonomous underwater gliders through the OceanGliders network can provide high-resolution measurements of air – sea heat fluxes, wind stress and the subsurface effects of El Niño. In regions such as the south-east Pacific, Data Buoy Cooperation Panel (DBCP) and OceanSITES moored buoys, Voluntary Observing Ships (VOS), Fishing Vessel Ocean Observing Network (FVON) and Global Sea Level Observing System (GLOSS) sea-level stations provide complementary observations. These contribute to regional El Niño monitoring and forecasts produced by the Permanent Commission for the South Pacific and the GOOS Regional Alliance for the South-East Pacific Region.
The strength of this observing system lies in the complementary nature of its networks: no single observing platform can capture everything happening across the ocean, from the surface to the deep ocean, as conditions change over time. Together, these observations provide the information needed to determine not only whether El Niño is developing, but how it is evolving and what may happen next.
The science behind El Niño forecasts
Before a forecast can be produced, observations from satellites, ships, buoys, Argo floats and other platforms are collected by national meteorological and oceanographic agencies, research institutions and international observing networks. The data are quality-controlled, standardized and exchanged internationally through systems including the International Oceanographic Data and Information Exchange (IODE) of the Intergovernmental Oceanographic Commission of United Nations Educational, Scientific and Cultural Organization (IOC-UNESCO) and the WMO Information System (WIS), within the broader WMO Integrated Global Observing System (WIGOS) framework.
The observations are then ingested into operational prediction systems and assimilated with numerical models to produce analysis, representing the best estimate of the current state of the ocean and atmosphere. This analysis provides the initial conditions for coupled ocean – atmosphere prediction models. The value of ocean observations is particularly clear when considering their effect on predictability: research has shown that ENSO prediction lead time decreases from about 4.5 months to 3.2 months when ocean observations are withheld from ocean data assimilation. This loss of more than one month of lead time illustrates how essential sustained ocean observations are for anticipating ENSO events.
Coupled models are used by the WMO Global Producing Centres for Seasonal Prediction (GPCs-SP) to simulate the interactions between the ocean and atmosphere over time to generate global seasonal forecasts. No single model can perfectly represent the complexity of the climate system. Each GPC-SP uses models that differ in several aspects, including their formulations, resolutions, parameterizations and methods for generating initial conditions, providing complementary representations of how the climate system may evolve.
The GPC-SP forecasts are collected and consolidated by the WMO Lead Centre for Seasonal Prediction Multi-Model Ensemble (LC-SPMME) to produce multi-model ensemble forecasts that provide more robust predictions and a more comprehensive representation of forecast uncertainty than any individual model alone.
For ENSO prediction, coupled models compute the Niño 3.4 index and other ENSO indicators for future seasons. The WMO LC-SPMME uses these model forecasts to assess the probability, expected strength and evolution of El Niño, La Niña or ENSO-neutral conditions. The status of ENSO, its interaction with other climate drivers, and how these drivers may influence global temperature and precipitation patterns in the following months are discussed in the WMO Global Seasonal Climate Update (GSCU).
While GSCU provides a synthesis of the direct outputs of seasonal prediction systems, the WMO El Niño/La Niña Update combines model guidance with expert scientific assessment to obtain a more comprehensive picture of the current ENSO state and its likely evolution. This expert assessment is important because ENSO cannot be identified or predicted reliably using a single variable, index or threshold. Experts assess multiple observations and model predictions together, looking for consistent evidence of changes in both the ocean and atmosphere. They also consider model limitations and uncertainties when interpreting the forecasts.
The WMO El Niño/La Niña Update and the GSCU provide complementary information that supports WMO Regional Climate Centres (RCCs) and National Meteorological and Hydrological Services (NMHSs) in developing regional and national climate products to inform early action, decision-making and planning. Seasonal forecasts provide an opportunity for early action, but they should not be considered static: as the season approaches and progresses, forecasts should be regularly updated and complemented by shorter-range forecasts and the latest observations. Users should therefore regularly consult forecasts and updates from their RCCs and NMHSs, which provide the most relevant information for their region or country.
What El Niño forecasts can tell us
An ENSO forecast indicates the likely timing, strength and evolution of El Niño, La Niña or ENSO-neutral conditions. Because ENSO is associated with large-scale atmospheric and oceanic teleconnections, it can increase or decrease the likelihood of wetter, drier, warmer or cooler conditions in different regions. It does not predict with certainty that a particular drought, flood or heatwave will occur.
No two El Niño events produce identical impacts. A very strong event increases the likelihood of conditions associated with typical El Niño teleconnections but does not guarantee them. Regional outcomes depend on the location and pattern of Pacific warming, the strength of the atmospheric response, the event’s timing and duration, and interactions with other climate drivers. Some effects appear while El Niño is developing or near its peak; others emerge later or persist after the tropical Pacific has begun to cool. The same event can affect regions differently, and the same region can experience different outcomes from one El Niño to another.
ENSO evolves over months, even though the ocean and atmosphere fluctuate from week to week. Operational ENSO outlooks are therefore generally expressed as three-month seasonal averages, rather than as forecasts of the ENSO state for a particular week. Their value lies in identifying periods of heightened risk early enough to support preparedness and early action. Even when uncertainty remains, forecast information can help decision-makers take proportionate measures and adjust their actions as new evidence becomes available and forecast confidence evolves. Seasonal ENSO forecasts can inform crop choices and planting dates, reservoir management, health preparedness, contingency planning and more. To guide action, however, a climate forecast must be considered alongside exposure, vulnerability, historical impacts, sectoral knowledge and shorter-range weather information.
Why sustained ocean observations matter
The 1982/83 El Niño caught the scientific community by surprise at a time when observations of the tropical Pacific were much more limited. In contrast, the 2026 El Niño was identified and forecast several months in advance, reflecting major advances in ocean observing, research and prediction.
Early detection, however, is only the beginning. Continuous observations are crucial for tracking the accumulation and movement of ocean heat, monitoring the evolving interaction between the ocean and atmosphere and distinguishing the ENSO signal from changes in the broader ocean background. This is particularly important as the 2026 El Niño is developing on top of a substantially warmer baseline ocean.
Observations are the foundation of prediction. The observing networks coordinated through GOOS bring together complementary measurements from the ocean surface to depth, from space and across the atmosphere. These observations are assimilated into coupled ocean – atmosphere climate models to establish the current state of the climate system and generate forecasts. As conditions evolve and new observations become available, forecasting systems can be updated, allowing predictions of El Niño and its potential impacts to be continually reassessed.
Sustaining GOOS and the research needed to advance our understanding of the ocean – atmosphere system is therefore essential as future ENSO events may unfold in an increasingly warm ocean. Together, sustained observations and research help turn knowledge into better forecasts, earlier action and more informed decisions.