Marine Heatwaves Are Key to Tracking Climate Change
- Author(s):
- Regina R. Rodrigues (UFSC), Hindumathi Palanisamy (WMO), Jessica Benthuysen (AIMS), Dillon Amaya (NC State), Catherine Gregory (University of Bern), Katie Smith (MBA), Robert Schlegel (IMEV), Thibault Guinaldo (Météo-France), Thomas Frölicher (UniBE), Roxy Koll (IITM), Antonietta Capotondi (NOAA), Cristian Martinez-Villalobos (UAI), Dan Smale (MBA), Huai-Min Zhang (CLIVAR), Neil Holbrook (University of Tasmania), Simona Masina (CMCC), Juliet Hermes (SAEON).

On 22 August 2026, the average sea-surface temperature outside the polar regions reached 21.1 °C, the highest ever measured, surpassing the previous record set in March 2024.
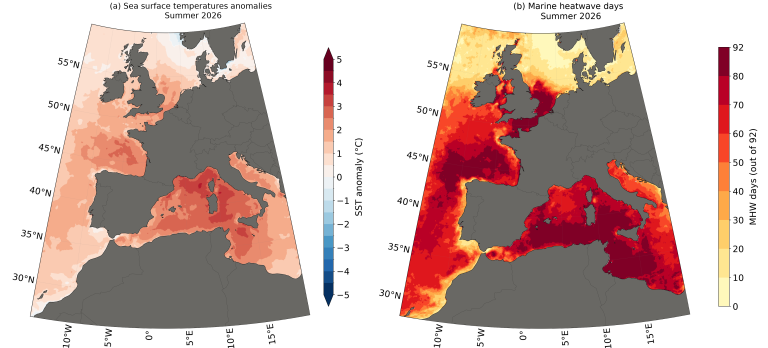
Nowhere was the heat more persistent than around Europe (Figure 1). Summer temperatures in the western Mediterranean climbed to record levels and widespread marine heatwaves developed. The Bay of Biscay, the Iberian coast and the Celtic seas each set all-time seasonal records. Scientists who examined the event found that human-induced climate change had made the Mediterranean extremes roughly 2 °C warmer, and that such conditions would have been extremely unlikely in a pre-industrial climate.
Events like this are no longer surprising. They are what a warming ocean now does routinely. The reason we could watch this one unfold almost in real time is a global observing system assembled quietly and internationally over decades.
What is a marine heatwave?
A marine heatwave is a discrete spell of unusually warm water: it has a start date, an end date and a mappable area. The most widely used definition compares each day’s temperature with what is normal for that place at that time of year, using a 30-year record, which is the same climate period WMO uses for weather statistics. When temperatures stay within the warmest 10% of that historical range for five days or more, a marine heatwave is underway.
Two things follow. Because the comparison is with local seasonal conditions rather than a fixed temperature, a marine heatwave in the Southern Ocean can be much colder than an ordinary day in the tropics, and marine heatwaves occur in winter as well as in summer. As with tropical cyclones, they can be graded by severity: moderate, strong, severe and extreme.
Why the signal is clearest at sea
The ocean has absorbed about 90% of the additional heat trapped by greenhouse gases. Almost everything else we notice about climate change, such as rising seas, melting ice, shifting weather, is linked to where that heat has gone.
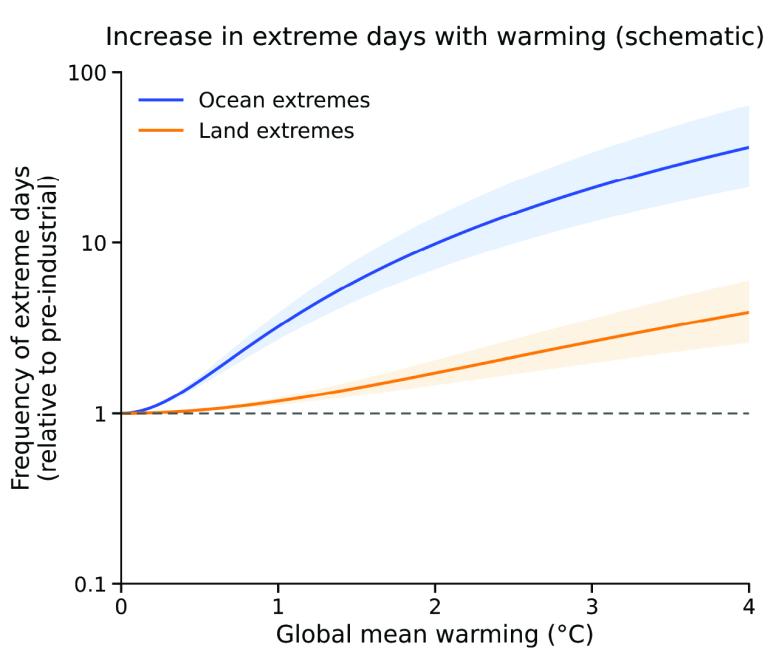
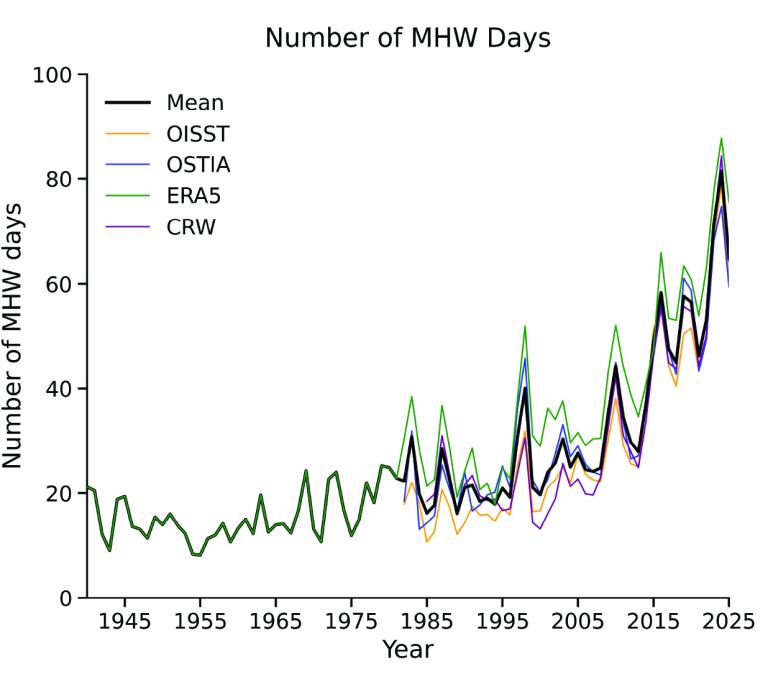
It might seem, then, that ocean warming would be the hardest signal to detect, because the sea surface warms more slowly than the land. The opposite is true: ocean temperature is remarkably steady, and its day-to-day variability is small compared with the swings in air temperature over land. Marine heatwaves are defined relative to local variability, so even a modest, steady rise in background temperature pushes the ocean past extreme thresholds far more often than a larger rise does on land (Figure 2). Consequently, marine heatwave days have more than tripled since 1991 (Figure 3).
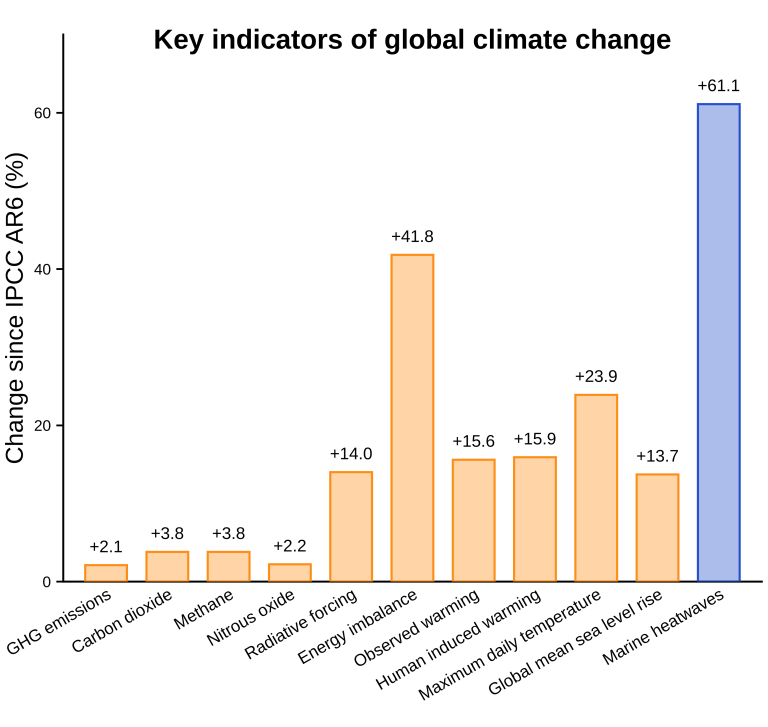
The result is one of the fastest-changing indicators in the climate system. Recent assessments of global climate indicators place the number of days the ocean is affected by marine heatwaves among the fastest-rising indicators since the IPCC’s Sixth Assessment Report. The increase has been far sharper than those in greenhouse gas emissions, changes in Earth's energy balance or observed global warming (Figure 4).
A global trend and a human fingerprint
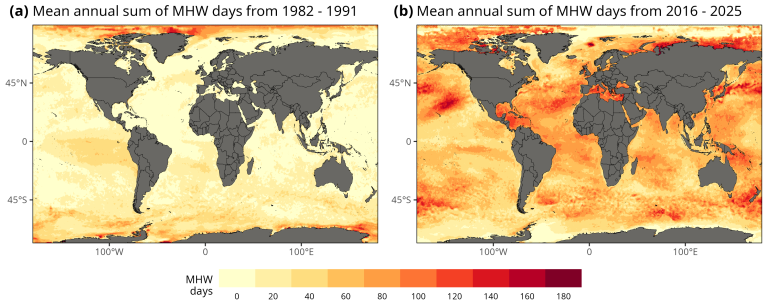
Marine heatwaves are becoming more common across all the world’s ocean basins. Comparing the first decade of the satellite record with the most recent one shows a widespread increase in the number of marine heatwave days across the Atlantic, Pacific, Indian, Southern, and Arctic oceans (Figure 5). WMO now tracks the extent of marine heatwaves each year in its State of the Global Climate report, alongside ocean heat content and sea level.
The increase is not uniform. Regional ocean circulation, atmospheric conditions and natural climate variability shape where and when marine heatwaves occur. These are not competing explanations: local conditions set the timing and the location, while a steadily warmer background raises the likelihood and the severity of each event.
Studies of individual marine heatwaves also demonstrate the influence of human-induced climate change. The 2015 – 16 marine heatwave in the Tasman Sea was at least 330 times more likely to last as long as it did and around seven times more likely to reach the same intensity because of human-induced warming. In the northeast Pacific, the extreme temperatures of 2014 were about five times as likely to occur for the same reason.
What this means for ecosystems and the people who depend on them
Marine heatwaves also do something no global average can. They turn a gradual trend into discrete events with a date, a location and a cost. A bleached reef, a lost kelp forest or a closed fishery is something people can see, count and act on.
Marine heatwaves are increasingly disrupting marine ecosystems and the livelihoods built on them. Repeated events have driven coral bleaching and mortality worldwide, and where reefs support tourism, the losses are already measurable. Fisheries and aquaculture have been hit hard, with direct costs running to billions of dollars globally and governments stepping in to compensate fishers. In many regions, though, the consequences for catches and coastal incomes have not yet been properly quantified.
Marine heatwaves also rarely arrive alone. They increasingly coincide with other pressures, such as ocean acidification and oxygen loss, forming compound events. Combined heat-and-acidity extremes now occur roughly four times more often than chance alone would produce across low and mid latitudes, and are projected to become more frequent as the ocean warms. For organisms already under heat stress, a second pressure compounds the damage rather than simply adding to it.
The effects reach beyond the ocean. Tropical cyclones gain strength over warm water, and marine heatwaves have intensified some of the most destructive storms of recent years. A 2026 global analysis found that cyclones which both intensified rapidly and passed over marine heatwave conditions were associated with 60% more billion-dollar disasters than storms without them. What is often described as an ocean anomaly is increasingly a hazard to coastal communities.
Eyes on the ocean
Satellites have provided a near-daily picture of sea-surface temperature since the 1980s, and they are the reason a four-decade global record exists at all. But satellites see only the ocean’s skin, and that matters more than it sounds. A global study found that only about half of marine heatwaves leave a continuous signal at the surface, while around a third remain entirely below it. Judging the ocean by its skin alone can miss the depth, persistence, and ecological damage of an event.
Everything below the surface must be measured in the water. Drifting buoys and merchant ships provide near-surface measurements that keep satellites calibrated. Initiatives such as 10 000 Ships for the Ocean are expanding real-time ocean and weather observations from commercial vessels. Moorings anchored in place monitor the tropical oceans. The Argo programme, which began in 1999 and reached its target of 3 000 floats in 2007, deploys robotic floats that drift through the upper 2 000 metres, surfacing regularly to report their measurements. Ocean reanalyses, which blend observations with models, knit all of this into a complete and physically consistent picture of the ocean’s state.
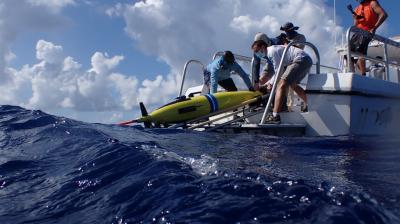
Some of the most valuable observations come from unlikely places. Ocean gliders are deployed to sample marine heatwaves as they occur. Temperature sensors fitted to fishing gear give commercial vessels a real-time view of the water beneath them. In the Southern Ocean, elephant seals carry instruments beneath the sea ice where satellites cannot see; off tropical Australia, sea turtles dive hundreds of metres and transmit data when they surface.
Gaps remain, and they are not evenly spread: the subsurface ocean, coastal waters, the deep ocean, high latitudes, and the biological and chemical measurements that connect temperature to ecological harm. Because a break in a long record can never be filled in afterwards, continuity is not a technical preference but a requirement. In particular, a marine heatwave is defined using 30 years of data, so the definition itself depends on the record being uninterrupted. The 2027 Global Climate Observing System Status Report, prepared for the United Nations Framework Convention on Climate Change, is the next opportunity to identify where global ocean observations are most at risk and needed.
From observation to early warning
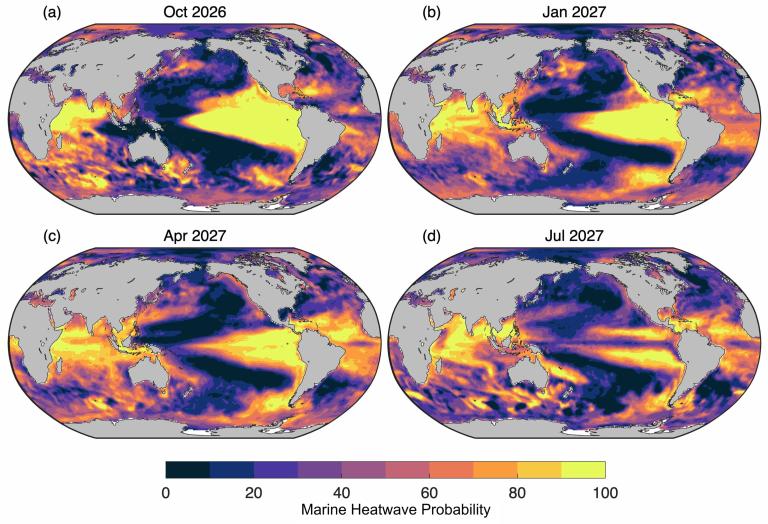
The same thermal memory that makes the ocean a good indicator also makes it, usefully, predictable. Because ocean temperature anomalies persist for weeks to months, forecast systems can anticipate marine heatwaves further ahead than most weather hazards, although skill still varies considerably by region and season. Forecasts issued in August 2026 indicate that marine heatwave conditions are likely to persist or intensify over the coming year (Figure 6).
Several national services have turned this into operational products. The United States National Oceanic and Atmospheric Administration publishes global marine heatwave forecasts, building on research into marine heatwave predictability, and the Australian Bureau of Meteorology issues outlooks that inform national and regional climate briefings. In Australia, those forecasts have supported response plans, targeted monitoring and industry preparedness during recent events.
The users are specific: aquaculture operators deciding whether to relocate or harvest stock early, fisheries managers adjusting effort, reef managers timing interventions, coastal authorities anticipating harmful algal blooms. For all of them, a few weeks of warning can help shift responses from crisis management to preparedness.
This is where marine heatwaves align with the wider agenda of WMO. Ocean extremes remain less integrated into national early warning systems than atmospheric hazards, and closing that gap sits directly within the ambition of Early Warnings for All. Combined with information on impacts, the same forecasts also inform longer-term adaptation choices for coastal communities and ocean-dependent sectors.
Marine heatwaves have become one of the clearest indicators of how far the ocean has changed. Turning that signal into warnings people can act on depends on sustained observations, open data, prediction systems and close collaboration with users. Maintaining this chain through continued research and international cooperation is essential to ensure that marine heatwave information remains scientifically robust and supports early warning, preparedness and long-term adaptation in a warming ocean.