Ir al contenido principal
  • عربي
  • 中文
  • English
  • Français
  • Русский
  • Español
World Meteorological Organization
Tiempo
Clima
Agua
Icono de búsqueda
Actividades
  • Todas las actividades
  • Proyectos
  • Objetivos de Desarrollo Sostenible
  • Conferencia de las Partes (CP)
  • Eventos y reuniones
Temas
  • Todos los temas
Noticias
  • Portal de noticias
  • Comunicados de prensa
Recursos
  • Publicaciones más recientes
  • Documentos
  • Publicaciones seriadas
  • Biblioteca electrónica
  • MeteoWorld
  • WMO Bulletin
  • Videos
  • StoryMaps
  • Fichas informativas
  • Photo Galleries
  • Podcasts
  • Campaigns
Comunidad
  • Comunidad de la OMM
  • METEOTERM
  • EC-78
  • SERCOM-3
  • INFCOM-3
Acerca de la OMM
  • Sinopsis
  • Secretaría
  • Nuestro mandato
  • Governance
  • Regions
  • WMO Members
  • مكاتب الاتصال
  • Office of the Legal Counsel of the Secretary-General
  • Gender Equality
  • Partnerships
  • Resource Mobilization
  • History of IMO and WMO
  • Finanzas y rendición de cuentas
  • Día Meteorológico Mundial
  • WMO Building
  • Youth Engagement

Migas de pan

  1. Inicio
  2. Bahrein

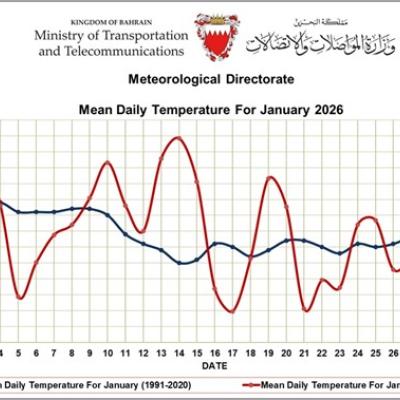
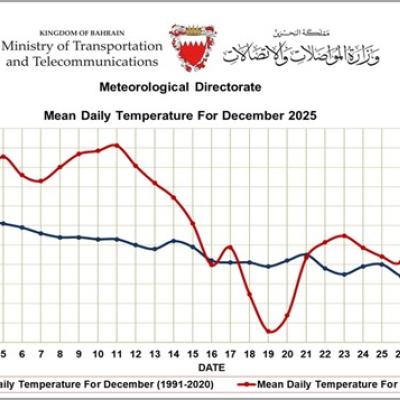
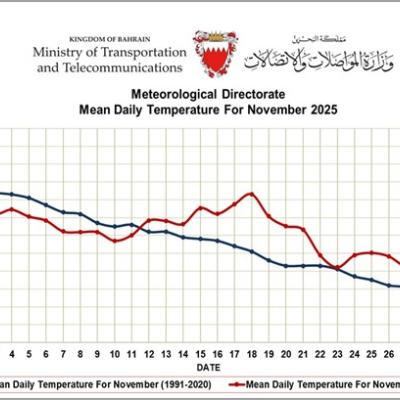
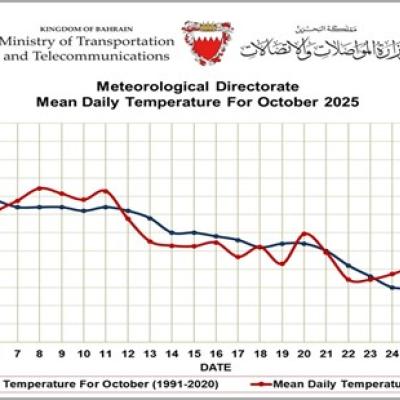
Bahrein

Plataforma comunitaria

Base de datos de perfiles de países

Servicios meteorológicos locales

Región II: Asia

News from Bahrein

Graph from the Ministry of Transportation and Telecommunications in Bahrain showing mean daily temperatures for June 2024 against a historical average (1991-2020).
05 de agosto de 2024
Monthly Weather Summary - July 2024
Graph showing the mean daily temperature in Bahrain for June 2024, with red and blue lines representing 2024 and 1991-2020 temperatures respectively. The 2024 line shows higher temperatures.
04 de julio de 2024
Monthly Weather Summary - June 2024
A line graph from Bahrain's Ministry of Transportation and Telecommunications compares mean daily temperatures for May 1991-2020 and May 2024, showing a rise in 2024 temperatures.
06 de junio de 2024
Monthly Weather Summary - May 2024
Line graph comparing mean daily temperatures for April 2025 and April averages from 1991-2020 in Bahrain, showing higher and more variable temperatures in 2025.
08 de mayo de 2025
Monthly Weather Summary - April 2025
Line graph showing mean daily temperatures for February 2025 and 1991-2020 in Bahrain. Temperatures fluctuate around 18-21°C, with a notable drop on the 28th in 2025.
06 de marzo de 2025
Monthly Weather Summary - February 2025
Graph of mean daily temperatures in January 2025 from the Meteorological Directorate of Bahrain, comparing historical (1991-2020) data with projected data. Temperature in Celsius.
11 de febrero de 2025
Monthly Weather Summary - January 2025
Line chart comparing mean daily temperatures in November 2024 (red) to historical data from 1991-2020 (blue) in Bahrain. The 2024 line shows higher temperatures overall.
02 de diciembre de 2024
Monthly Weather Summary - November 2024
Line graph showing mean daily temperatures in Bahrain for October 2024 (red), compared with 1991-2020 average (blue). The 2024 temperatures start higher and decline steadily, meeting the average at month's end.
06 de noviembre de 2024
Monthly Weather Summary - October 2024
Line graph of mean daily temperatures in Bahrain for September 2024, showing actual 2024 temperatures (red) compared with 1991-2020 average (blue). Data shows fluctuation in temperatures.
11 de octubre de 2024
Monthly weather summary - September 2024
Graph from the Ministry of Transportation and Telecommunications in Bahrain showing mean daily temperatures for June 2024 against a historical average (1991-2020).
05 de agosto de 2024
Monthly Weather Summary - July 2024
Graph showing the mean daily temperature in Bahrain for June 2024, with red and blue lines representing 2024 and 1991-2020 temperatures respectively. The 2024 line shows higher temperatures.
04 de julio de 2024
Monthly Weather Summary - June 2024
A line graph from Bahrain's Ministry of Transportation and Telecommunications compares mean daily temperatures for May 1991-2020 and May 2024, showing a rise in 2024 temperatures.
06 de junio de 2024
Monthly Weather Summary - May 2024
World Meteorological Organization
Bienvenido a la Organización Meteorológica Mundial
Empleos en la OMM
Infórmese sobre las oportunidades de empleo en la OMM
Edificio de la OMM
Historia de nuestra sede
Compras
Consulte las últimas licitaciones
Premios
Contribuciones destacadas reconocidas con premios de la OMM
Contacto
Vías para ponerse en contacto con la OMM
© 2025 Organización Meteorológica Mundial (OMM)
Derechos de autor
Descargo de responsabilidad
Política de privacidad
Denuncias de fraude, corrupción o abuso