  • عربي
  • 中文
  • English
  • Français
  • Русский
  • Español
Всемирная Метеорологическая Организация
World Meteorological Organization
Temps
Climat
Eau
Icône de recherche
Activités
  • Voir toutes les activités
  • Projets
  • Objectifs de développement durable
  • Conférence des Parties (COP)
  • Événements et réunions
Domaines
  • Tous les domaines
Actualités
  • Portail d'actualités
  • Communiqués de presse
Ressources
  • Dernières publications
  • Documents
  • Séries de publications
  • Bibliothèque
  • MeteoWorld
  • WMO Bulletin
  • Vidéos
  • StoryMaps
  • Fiches d’information
  • Galerie de photographies
  • Podcasts
  • Campaigns
Communauté
  • Communauté de l'OMM
  • METEOTERM
  • EC-78
  • SERCOM-3
  • INFCOM-3
À propos de l’OMM
  • Aperçu général
  • Le Secrétariat
  • Notre mandat
  • Gouvernance
  • Régions
  • Membres de l’OMM
  • Bureaux de liaison
  • Office of the Legal Counsel of the Secretary-General
  • Gender Equality
  • Partenariats
  • Mobilisation des ressources et partenariats pour le développement
  • Histoire de l'OMI et de l'OMM
  • Finances et transparence
  • Journée météorologique mondiale
  • Le bâtiment de l’OMM
  • Youth Engagement

Fil d'Ariane

  1. Accueil
  2. Bahreïn

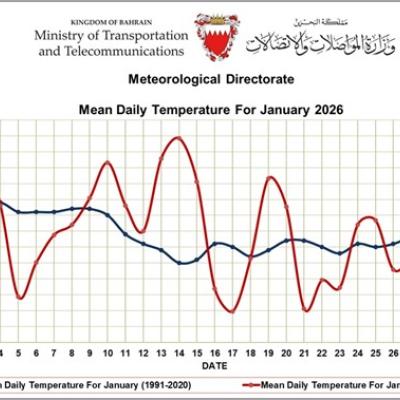
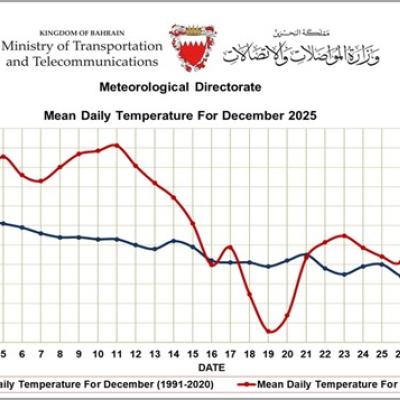
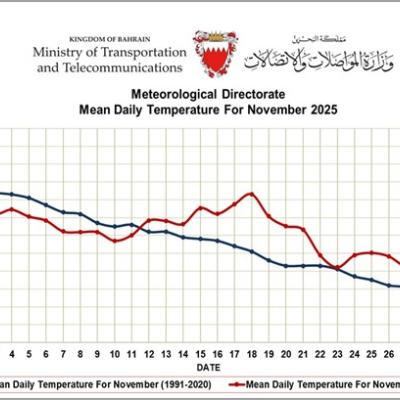
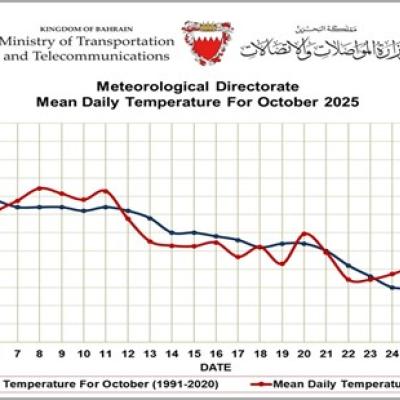
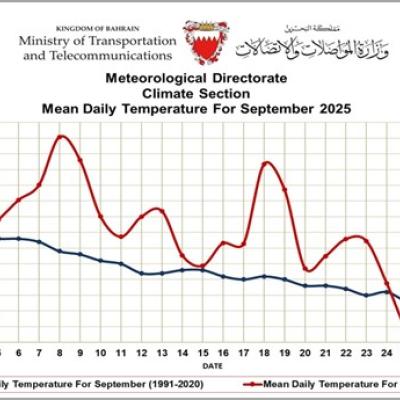
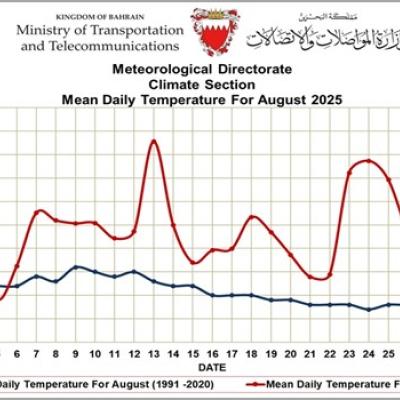
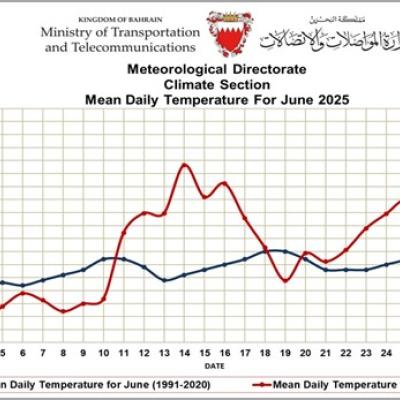
Bahreïn

Plate-forme communautaire

Base de données des profils de pays

Services météorologiques locaux

Région II: Asie

News from Bahreïn

Graph from the Ministry of Transportation and Telecommunications in Bahrain showing mean daily temperatures for June 2024 against a historical average (1991-2020).
05 août 2024
Monthly Weather Summary - July 2024
Graph showing the mean daily temperature in Bahrain for June 2024, with red and blue lines representing 2024 and 1991-2020 temperatures respectively. The 2024 line shows higher temperatures.
04 juillet 2024
Monthly Weather Summary - June 2024
A line graph from Bahrain's Ministry of Transportation and Telecommunications compares mean daily temperatures for May 1991-2020 and May 2024, showing a rise in 2024 temperatures.
06 juin 2024
Monthly Weather Summary - May 2024
Line graph comparing mean daily temperatures for April 2025 and April averages from 1991-2020 in Bahrain, showing higher and more variable temperatures in 2025.
08 mai 2025
Monthly Weather Summary - April 2025
Line graph showing mean daily temperatures for February 2025 and 1991-2020 in Bahrain. Temperatures fluctuate around 18-21°C, with a notable drop on the 28th in 2025.
06 mars 2025
Monthly Weather Summary - February 2025
Graph of mean daily temperatures in January 2025 from the Meteorological Directorate of Bahrain, comparing historical (1991-2020) data with projected data. Temperature in Celsius.
11 février 2025
Monthly Weather Summary - January 2025
Line chart comparing mean daily temperatures in November 2024 (red) to historical data from 1991-2020 (blue) in Bahrain. The 2024 line shows higher temperatures overall.
02 décembre 2024
Monthly Weather Summary - November 2024
Line graph showing mean daily temperatures in Bahrain for October 2024 (red), compared with 1991-2020 average (blue). The 2024 temperatures start higher and decline steadily, meeting the average at month's end.
06 novembre 2024
Monthly Weather Summary - October 2024
Line graph of mean daily temperatures in Bahrain for September 2024, showing actual 2024 temperatures (red) compared with 1991-2020 average (blue). Data shows fluctuation in temperatures.
11 octobre 2024
Monthly weather summary - September 2024
Graph from the Ministry of Transportation and Telecommunications in Bahrain showing mean daily temperatures for June 2024 against a historical average (1991-2020).
05 août 2024
Monthly Weather Summary - July 2024
Graph showing the mean daily temperature in Bahrain for June 2024, with red and blue lines representing 2024 and 1991-2020 temperatures respectively. The 2024 line shows higher temperatures.
04 juillet 2024
Monthly Weather Summary - June 2024
A line graph from Bahrain's Ministry of Transportation and Telecommunications compares mean daily temperatures for May 1991-2020 and May 2024, showing a rise in 2024 temperatures.
06 juin 2024
Monthly Weather Summary - May 2024
World Meteorological Organization
Bienvenue à l'Organisation météorologique mondiale
Travailler à l'OMM
Découvrez les opportunités d'emploi à l'OMM
Bâtiment de l’OMM
L'histoire de la création de notre siège
Achats
Voir les derniers appels d'offres
Prix
Les prix de l'OMM récompensent des contributions exceptionnelles
Nous contacter
Comment contacter l'OMM
© 2025 Organisation météorologique mondiale (OMM)
Droits d'auteur
Responsabilité
Politique de confidentialité
Signaler une fraude, un cas de corruption ou un abus