
WMO bulletin shows air quality and climate interlinkages

7 September 2026

An increase in pollution from wildfires and heatwaves risks undermining international efforts to improve air quality and protect human and ecosystem health, according to a new report from the World Meteorological Organization (WMO), which traces the complex interlinkages between air quality and climate. 

Related Topics

The WMO report highlights the need for improved atmospheric observations of air pollutants such as fine particulate matter, and ground-level ozone, as well as aerosol like black carbon and microplastics, which are not sufficiently monitored even though they are widespread and are potentially harmful to ecosystems. It stresses the importance of complementary and coordinated policies on air quality and climate because they cannot be dealt with in isolation.  

The annual Air Quality and Climate Bulletin sheds light on the negative impacts of aerosol, including particulate matter, and surface ozone on human health.  

The report, which features a series of articles written by the scientific community advising WMO on air quality, was released for International Day of Clean Air for blue skies on 7 September. It is based on data and information from WMO’s Global Atmosphere Watch network, enshrining its philosophy of science for services for the public good.  

Key findings

Particulate Matter PM2.5 is composed of microscopic particles and droplets of less than 2.5 micrometres (μm) in diameter, which is a health hazard because it can penetrate deep into the lungs and bloodstream. It is emitted by many different sources such as  industrial activities, agriculture, residential heating and transport,  as well as wildfires and dust storms.  

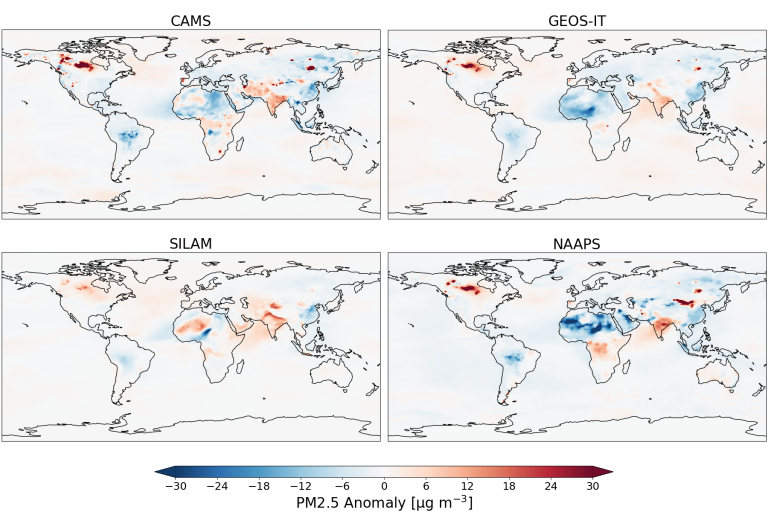
Four world maps show PM2.5 anomaly data from CAMS, GEOS-IT, SILAM, and NAAPS models, with blue for negative and red for positive anomalies.
Third-party maps. These maps were provided by CAMS, NASA GEOS-IT, the Finnish Meteorological Institute’s SILAM and NAAPS on 11 May 2026 and may not fully align with United Nations and WMO map guidance.

In keeping with trends in recent years, PM2.5 concentrations in 2025 were above the long-term average in northern Canada, part of the Russian Federation and western-central Africa due to increased fire activity. North-western Spain was also a hot spot because of exceptional fires in late summer 2025.

In South America’s Amazonia, burning was relatively lower in 2025 than previous years.  

PM2.5 levels continued to below the long-term average in China in 2025, reflecting a decline in emissions from human activities. India continue to have above average levels because of biomass burning and other pollution, according to the bulletin which, for the first time, used models from four different sources. Despite the difference in the models and inputs, the results are comparable and for the most part consistent, indicating a robust understanding of atmospheric processes.  

Wildfire emissions  

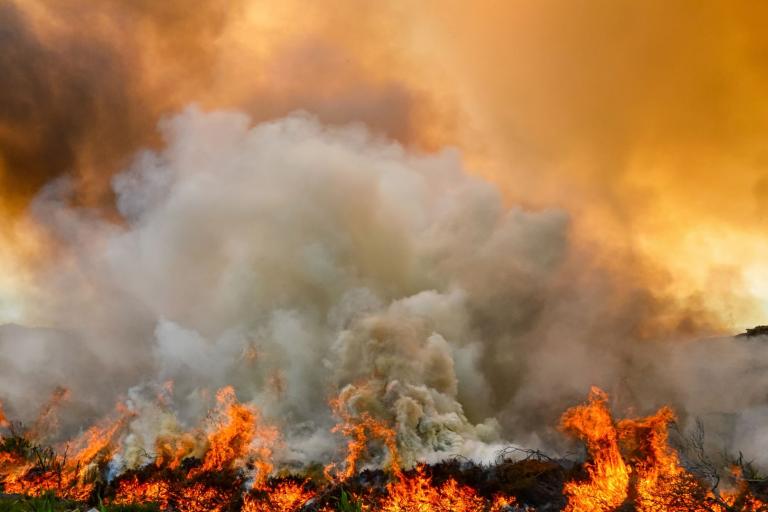
Extreme wildfires are increasing, leading to big health consequences because of the high toxicity of smoke. Whilst regulations in Europe and North America have reduced industrial and transport PM2.5 emissions, exposure to fire-related PM2.5 has increased.

One study cited by the WMO Bulletin indicates that extreme fire-smoke events have tripled globally since the 1990s, contributing to an estimated nearly 100,000 additional deaths per year between 2010-2018 – although this may well be an underestimate.

Current air quality risk assessments often fail to adequately capture the enhanced toxicity of wildfire smoke. An epidemiological study showed that conventional risks models based on total PM2.5 concentrations may underestimate wild-fire-attributable mortality by up to 93%, highlighting the need account for the higher toxicity of fie-derived particles in these models.

“Meeting the World Health Organization air quality guidelines will become progressively more difficult, since extreme fire weather is expected to increase in the future,” it says.

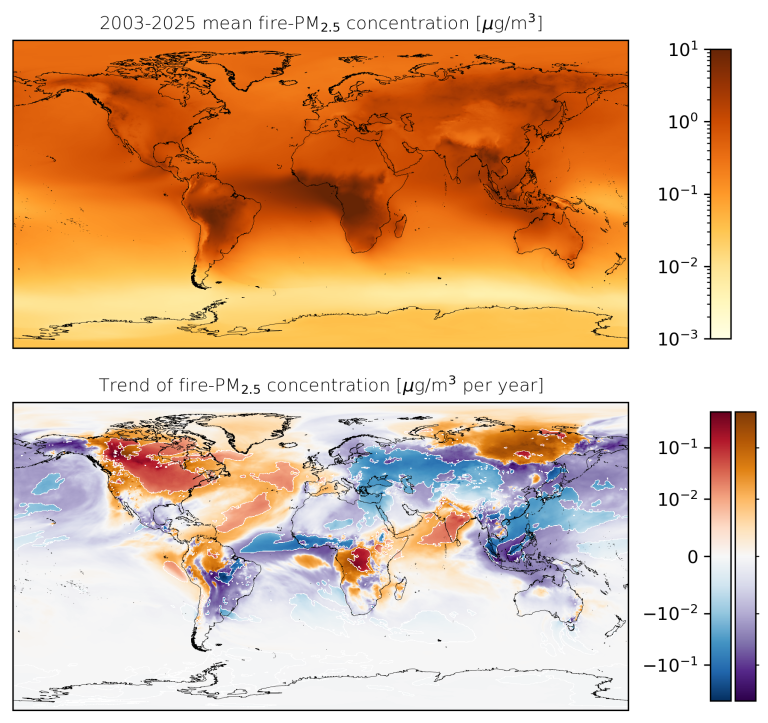
Two world maps show average fire-PM2.5 concentration from 2003–2025 and annual trend, using color scales to highlight geographic variations and changes in air pollution levels.
(a) Annual mean PM2.5 population exposure in the period 2003–2025 and (b) corresponding trends in exposure over the same period. Significant trends (p <0.05) are shown using red–blue colours, whereas non-significant trends are represented using orange–magenta colours (data from Romanello et al., in preparation). Third-party maps. These maps were provided by the Finnish Meteorological Institute’s SILAM (also outlined in the Global particulate matter concentrations section of this Bulletin) on 11 May 2026 and may not fully align with United Nations and WMO map guidance.

Heatwaves and ozone

Ground-level ozone pollution affects human health, agriculture and ecosystems – and it is a growing problem because of heatwaves. Long-term exposure to ozone pollution is associated with increased mortality, primarily through respiratory diseases.

Rising temperatures, stagnant atmospheric conditions and intense solar radiation promote ground-level ozone formation, as shown by recent studies during heatwaves in the south-eastern USA, Europe and China. This increased exposure to ozone pollution has the potential to lead to tens of thousands of additional premature deaths.  

“Looking forward, ozone-related health risks are expected to intensify,” it says.  

Aerosol

Aerosol particles can travel far from their sources, across oceans and continents and can alter the way the atmosphere reflects sunlight. They  can also change the chemical properties of land and water bodies and polluting otherwise clean environments.  

One example is the deposition of black carbon – or soot – on snow and ice, which reduces the amount of sunlight reflected by these surfaces – and in turn can hasten the melting process.  

Another example is microplastics, formed when plastics break down due to sunlight and other factors. They are found everywhere -  in the atmosphere, on land and in the ocean – with one Earth System Model simulation estimate of 51 million tonnes for land and 22 million tonnes for the ocean – which are in turn a source of microplastics for the atmosphere. However, there are huge variations in the estimates because of insufficient sustained monitoring.  

“As plastic production and, critically, mismanaged plastic waste, continues to increase, monitoring atmospheric pathways of deposition of microplastics to remote environments will be crucial towards understanding their overall impacts on the Earth system,” says the