February sees low sea ice and extreme weather
Sea ice extent in Antarctica reached an all-time minimum in February for the second consecutive year. Arctic sea ice extent was the second lowest (joint) on record. Sea ice has a big influence on global, regional and local weather patterns, and vice versa, and is a key climate indicator in WMO’s State of the Global Climate reports.
Sea ice extent in Antarctica reached an all-time minimum in February for the second consecutive year. Arctic sea ice extent was the second lowest (joint) on record. Sea ice has a big influence on global, regional and local weather patterns, and vice versa, and is a key climate indicator in WMO’s State of the Global Climate reports.
Globally, it was the fifth warmest February on record, with many extremes in temperature and precipitation, according to the EU’s Copernicus Climate Change Service. Europe had its second warmest winter on record.
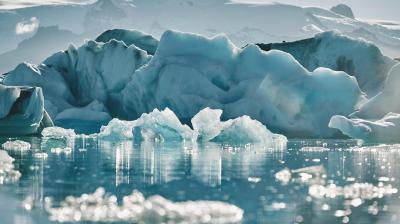
Sea ice
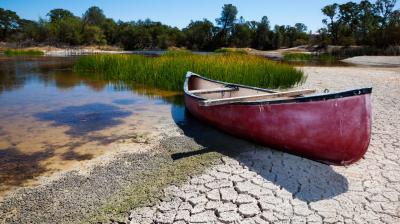
Changes in sea ice extent can have major impacts on society and ecosystems.
The Arctic is warming more than twice as fast as the global average warming. As a result, Arctic sea ice has retreated dramatically over the 45-year satellite record. Sea ice extent was the second joint lowest on record at the end of the winter freezing period in February, or 1.12 million square kilometers (432,000 square miles) below the 1981 to 2010 average (15.30 million square kilometers or 5.91 million square miles), according to the US National Snow and Ice Data Center (NSIDC) and the EU’s Copernicus Climate Change Service.
Antarctic sea ice extent tracked at record lows in both January and February. By the end of February, extent was 1.83 million square kilometers (707,000 square miles). This is 93,000 square kilometers (35,900 square miles) below the record seasonal minimum in February 2022.
Throughout last year, the extent of sea ice was generally low in Antarctica, with new ice thinner and more fragile than normal.
It is too early to conclude whether this is part of natural weather fluctuations or a new long-term melting trend as a result of climate change – which can have major knock-on implications for sea level rise (the sea ice and ice shelves act to “buttress“ the mass of ice on the land).
Antarctic sea ice extent has traditionally shown large inter-annual and regional variability between West Antarctica and the Antarctic peninsula, and the much bigger East Antarctica. However some scientists say this may be changing. Over the past decade, there is less regional variability and this has contributed to the lower Antarctic sea ice extents that have been observed since 2016.
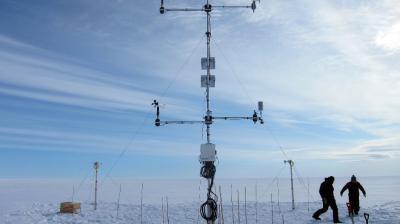
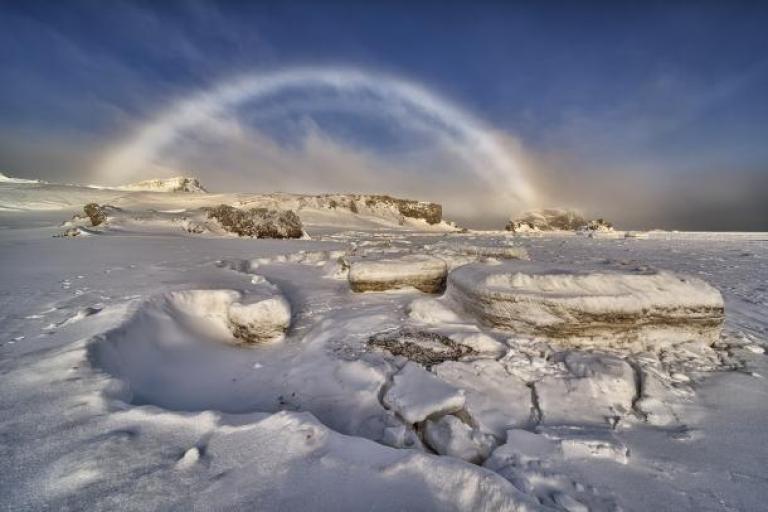
Spanning 14 million km2 (roughly twice the size of Australia), the Antarctic is cold, windy and dry. The average annual temperature ranges from about −10°C on the Antarctic coast to −60°C at the highest parts of the interior. Its immense ice sheet is up to 4.8km thick and contains 90% of the world’s fresh water, enough to raise sea level by around 60 metres were it all to melt. The Antarctic Peninsula (the northwest tip near to South America) is among the fastest warming regions of the planet, almost 3°C over the last 50 years.

Temperatures and precipitation
Winter was the joint second warmest on record for Europe, with much above-average temperatures over eastern Europe and parts of north-eastern Europe, according to the Copernicus Climate Change Service operated by ECMWF.
Temperature highlights for February
- February 2023 was the fifth warmest globally
- Most of Europe had above-average air temperatures, particularly in high northern latitudes
- Above-average temperatures occurred in the eastern United States, northern Russia, and in Pakistan and India
- Below-average temperatures were experienced across the Iberian Peninsula, Türkiye, the western United States, Canada, , and northern Australia
Hydro highlights for February 2023
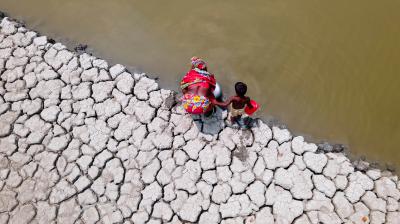
- In February 2023, most of western and southern Europe experienced drier-than-average conditions, several regions saw record low levels of soil moisture, according to Copernicus.
- Beyond Europe, it was wetter than average in southern USA, regions of Russia, central and eastern Asia, northern Australia, southern Brazil, south-eastern Africa and New Zealand. In many cases, heavy precipitation, sometimes associated with cyclones, led to flooding.
- Among the drier-than-average regions were parts of South America, which also experienced heatwaves, exacerbating drought and wildfires, as well as southern Australia and west of southern Africa.
Sudden Stratospheric Warming
A Sudden Stratospheric Warming (SSW) event occurred in February. During a SSW, the Polar Vortex breaks down and there is a rapid warming at high altitudes, from around 10 to 50 km height.
This may shift surface weather patterns some days to weeks later because it propagates down to the lower atmosphere, the jetstream becomes wavier and blockings develop. Cold air from polar regions tend to spread towards more southern latitudes and stay there for some days or weeks.
This has affected weather patterns in March, with a strong blocking over Greenland.
Well below average temperatures are being observed and expected for next days in large parts of Canada, western and central USA and northern Eurasia. On the other hand, far northeastern regions of Canada and Greenland are experiencing much warmer than average conditions.
The understanding of SSWs has improved recently, including the predictability of their influences to surface weather patterns but there are still some progresses to be made.